
Success story #7: Oussama El Mottaqy - visualising market structure for smarter decisions
Oussama turns complex market behaviour into clear, actionable visuals and has already made more than 70 sales on the cTrader Store.

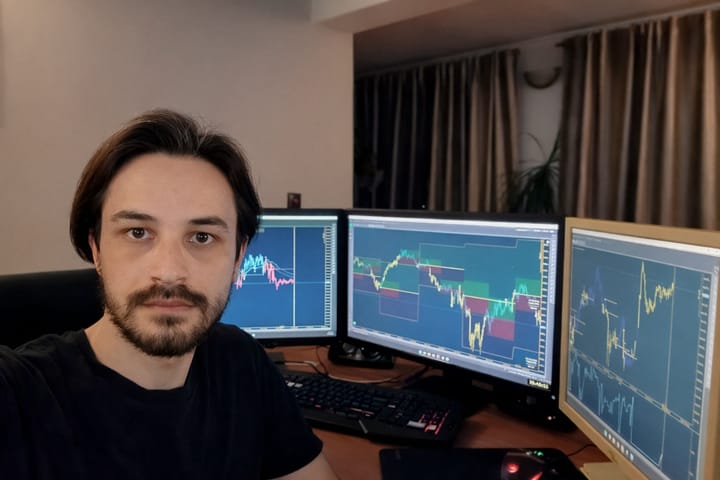
Oussama’s trading journey began with a simple question: why does the market move the way it does? What started as curiosity around XAUUSD and major forex pairs grew into a focus on structure, timing and precision. When he could not find tools that showed these ideas clearly, he began building his own tools. Over time, those early experiments turned into a small product line on cTrader Store, with steady engagement from traders and and more than 70 sales so far.
Turning market data into visual clarity
Over the years, Oussama, known as zelisalgo.systems, learned to transform market logic into practical, data‑driven tools, focusing on intraday structure, liquidity and session timing. Today, his products help traders understand where liquidity sits, when volatility is likely to appear, and how market structure develops throughout the day.
Oussama receives regular feedback from traders who say his tools make their sessions easier to navigate, especially those who trade intraday or work with ICT concepts. They mention clearer timing, better structure recognition and more confidence in identifying zones where the market is likely to react. This steady engagement motivates him to keep refining his products and designing visuals that help traders make decisions faster and with more certainty.
“I measure success by user satisfaction and how my tools perform in real trading, not just by sales numbers. What motivates me most is knowing that something I built helps others trade more confidently.”
Oussama also uses all his indicators and bots in live trading, primarily on XAUUSD and major forex pairs. His tools help him structure his sessions, identify liquidity zones and make better intraday decisions.

Outside the charts
Outside the charts, Oussama enjoys exploring the Moroccan coastline, especially around Asilah and Tangier, and photographing everyday scenes that inspire him. Professionally, he works in email marketing and customer service, which shaped his focus on clean design, clarity and user experience in every tool he builds.
Why cTrader
For Oussama, choosing cTrader was a deliberate decision:
“I chose cTrader because it’s transparent, modern and developer‑friendly. It gives me the freedom to innovate while maintaining high performance and trust.”
The platform’s speed, clean execution, intuitive visuals and flexible Automate API made it the ideal environment for building tools focused on clarity and structure.
Advice to other traders
Oussama encourages new traders and developers to focus on consistency rather than quick results. He believes that steady learning, regular testing and careful refinement are more valuable than chasing rapid success.
He also emphasizes the importance of understanding market structure before attempting to build or follow any strategy, since recognising how the market moves makes decision-making much more reliable.
Inspired by Oussama’s story?
Join the creators shaping the future of trading on cTrader Store.
Featured products
Oussama now offers several tools designed for visualising structure, timing and liquidity. His most popular releases include:


ICT Killzones visualises all major ICT sessions for traders who depend on precise institutional timing in their intraday workflow.
ICT Fibonacci Killzone cBot combines ICT logic with Fibonacci confluence to automate high‑probability killzone entries for session‑based intraday traders.
Support & Resistance Pro highlights key market levels for traders who rely on structure-based decision making.
Smart Volume Delta reveals institutional buying and selling pressure for traders who rely on volume signals to confirm entries and exits.
These tools have received positive feedback and steady engagement from traders worldwide, which motivates him to keep refining and expanding his work.
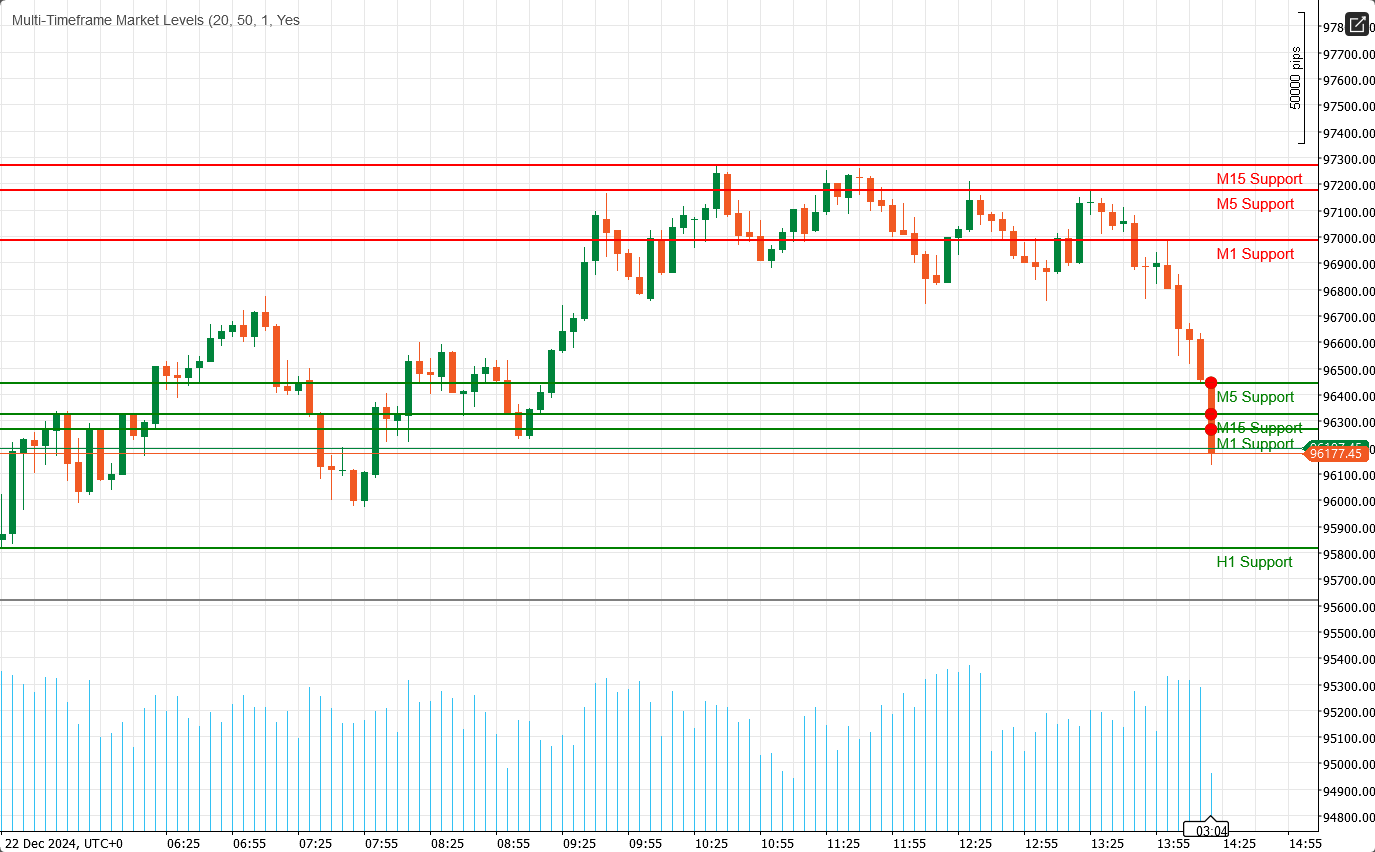
Multi-Timeframe Market Levels
Multi-Timeframe Market Levels is an indicator shows support and resistance levels from several timeframes on a single chart and creates a clear hierarchy of zones that matter most. It helps traders understand where price is likely to react by combining higher‑timeframe context with intraday structure.

Key features:
• Displays levels from M1, M5, M15, H1, H4 and D1 on one chart
• Offers a clean visual hierarchy, distinguishing major levels from minor ones
• Allows traders to customise which timeframes appear
• Helps identify reversal points, compression zones and confluence
User feedback
“Displays support/resistance levels from multiple timeframes in one chart. Clear visual hierarchy and flexible settings.”
Final thoughts
Oussama’s story shows how clarity, structure, patience and visual thinking can grow into a meaningful creative practice. With over 70 completed sales, he plans to continue developing ICT‑based systems, expand his tools for liquidity and timing visualisation, and build intuitive automation that makes complex market concepts easier for everyday traders.
“Each release teaches me something new, and seeing traders use my tools confidently is the biggest reward.”
Inspired by Oussama’s story?
Join the creators shaping the future of trading on cTrader Store.


Comments ()